


Install and Use SQL Server Report Builder
- Blog
- SQL Server
- Post

In this article, Michael Otey shows you how to use SQL Server Report Builder.
SQL Server Report Builder and Reporting Services
Microsoft SQL Server Reporting Services (SSRS) enables you to create, deploy, and manage printed, web, email, and mobile reports using data from SQL Server databases and Analysis Services (SSAS) as well as other relational database such as Oracle, MySQL, and Azure SQL Database.
SSRS is one of tools in the Microsoft Business Intelligence (MSBI) suite. The other MSBI tools include Microsoft SQL Server Analysis Services and Microsoft SQL Server Integration Services.
Reporting Services reports are based on query results and they provide insights into operational and management data. SSRS reports can be incorporated into web and Windows-based applications as well as viewed in SharePoint, Power BI dashboards and mobile devices like Android and iOS.
SQL Server Reporter Builder versus Report Designer
Microsoft supplies two different tools for building reports with SSRS: Reporter Builder and Report Designer. Report Designer is a somewhat more powerful tool that’s now supplied as an extension to Visual Studio in the form of SQL Server Data Tools (SSDT).
In past releases, Report Designer was a part of Business Intelligence Development Studio (BIDS). In contrast, Report Builder is a somewhat more user-friendly standalone tool. Both tools build SSRS reports that consist of Report Definition Language (RDL) which is an XML based format. The reports that are produced by either tool can be viewed and modified using the other report building tool. These reports are saved in the report server database. In this article we’ll look at how you can get started building SSRS reports using Report Builder. If you want more information about using Report Designer you can look at How to Create and Edit a Report in SQL Server Reporting Services or Create a basic table report (SSRS tutorial).
Download SQL Server Report Builder
You can get the installation program for SSRS 2022 Report Builder from a couple of different sources. First, Report Builder can be downloaded from the Microsoft Download Center or you can get it from the web portal of a report server. From these locations, you can download ReportBuilder.msi, the Report Builder installation program which will allow you to install Report Builder and its components.
Install SQL Server Report Builder
Now let’s install SQL Server Report Builder.
- Running ReportBuilder.msi will initially display the Welcome to the Installation Wizard for Microsoft Report Builder screen like the one you can see below.
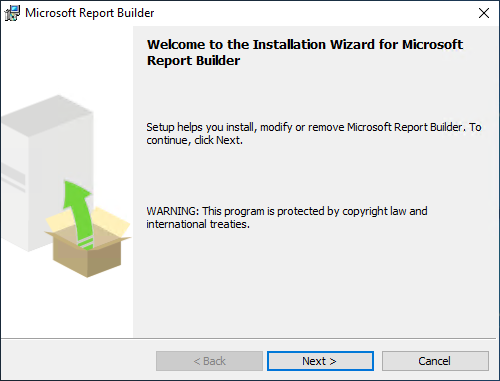
- Clicking the Next button begins the Report Builder installation process and the following License Agreement dialog will be displayed.
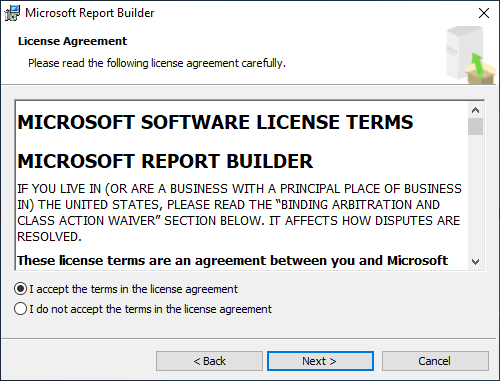
- To continue the installation, you need to select the I accept the terms in the license agreement radio button.
- Then click Next to display the following Feature Selection dialog.
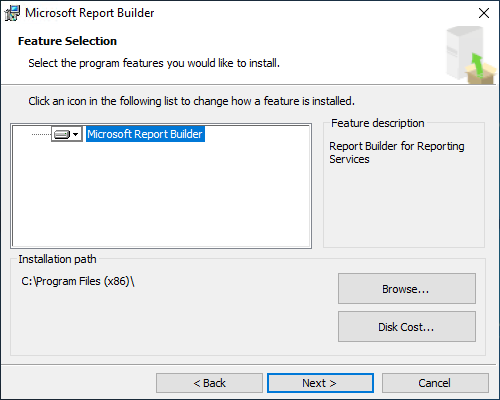
- On the Feature Selection dialog make sure the Microsoft Report Builder feature is selected.
- You can customize the installation location by clicking the Browse button but by default Report Builder will be installed at c:\Program Files (x86). Most organizations will not need to change this.
- If you are concerned about having adequate disk storage for the program you can check by using the Disk Cost button.
- Clicking Next will display the Default Target Server dialog that you can see in the following figure.
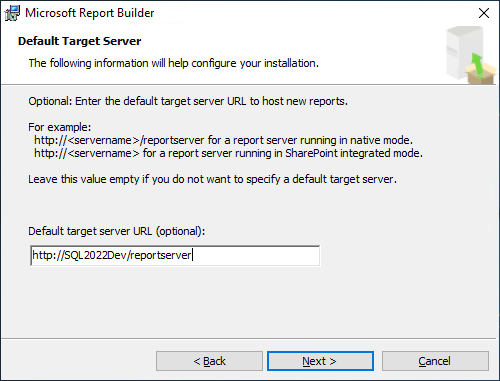
The Default Target Server dialog enables you to configure Report Builder with the main SSRS server’s URL. This URL is needed for Report Builder to communicate with Reporting Services to publish and run reports.
In this example there is a Reporting Services instance installed using the default settings on a server named SQL2022Dev. Here, the SSRS server URL is http://SQL2022Dev/reportserver.
- You will need to use the name of your own server and URL directory if you changed it to something other than the default value of reportserver.
- Clicking Next displays the Ready to Install the Program dialog shown below.
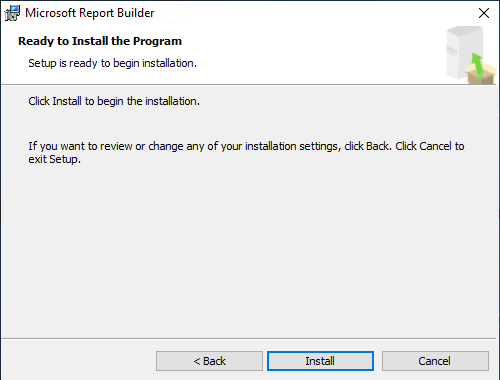
- At this point, Report Builder is ready to install. Clicking the Install button will begin the actual installation process which only takes about a minute.
- When the installation is complete, you’ll see the Completing the Microsoft Report Builder Installation screen that you can see below.
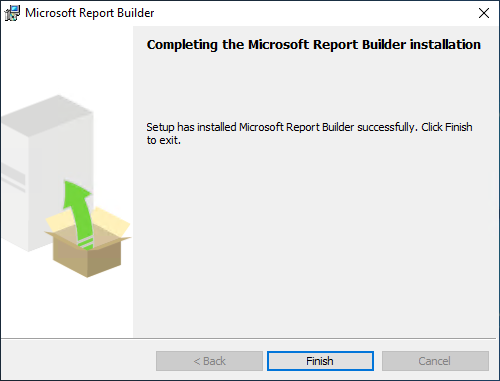
- After the Report Builder installation is finished click the Finish button and you’re ready to begin using Report Build to create SSRS reports.
Creating your first report with Report Builder
Now let’s build our first report.
- You can launch Report Builder using the Start menu and then selecting the Microsoft Report Builder, Report Builder option. This will launch the initial Report Builder screen that you can see below.
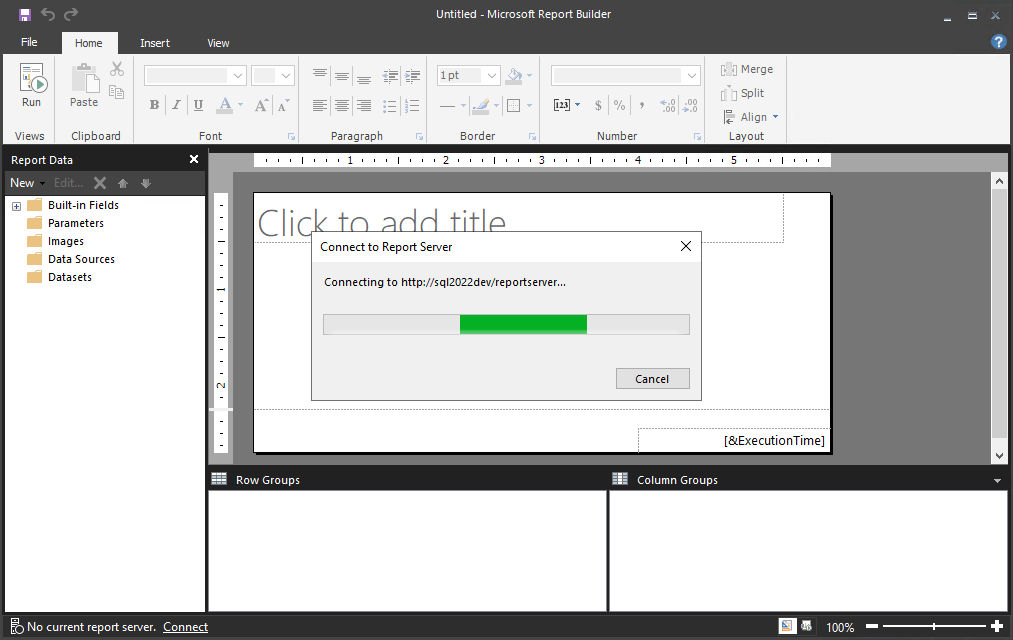
This screen will automatically start a connection to the server URL that you used when you installed Report Builder. In this example you can see that it is starting a connection to http://sql2022dev/reportserver. The initial connection takes a couple of minutes to set up and after it has connected, you’ll see a Getting Started dialog like the one shown in the following figure.
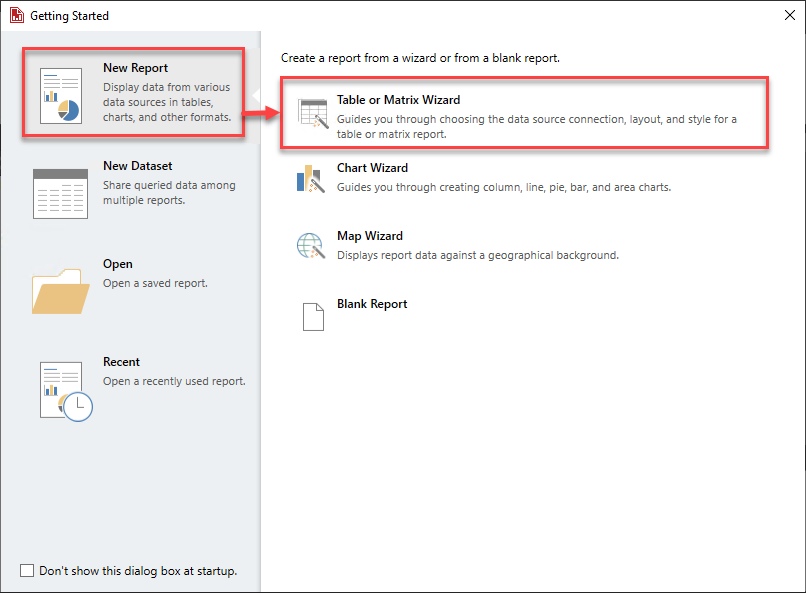
- To create your first report, on the Getting Started dialog first select New Report from the left pane then click on Table or Matrix Wizard.
- If you have an existing report you can use the Open option to edit the report.
- Clicking on the Table or Matrix Wizard option that’s shown at the top of the right pane will display the New Table or Matrix dialog that you can see below.
Tables and matrixes are the most common type of reports. You could also elect to create a chart and graphs type of report using the Chart Wizard or a map report using the Map Wizard. Or you could choose to start off with a completely blank report where you must manually add the reports datasets, queries and columns.
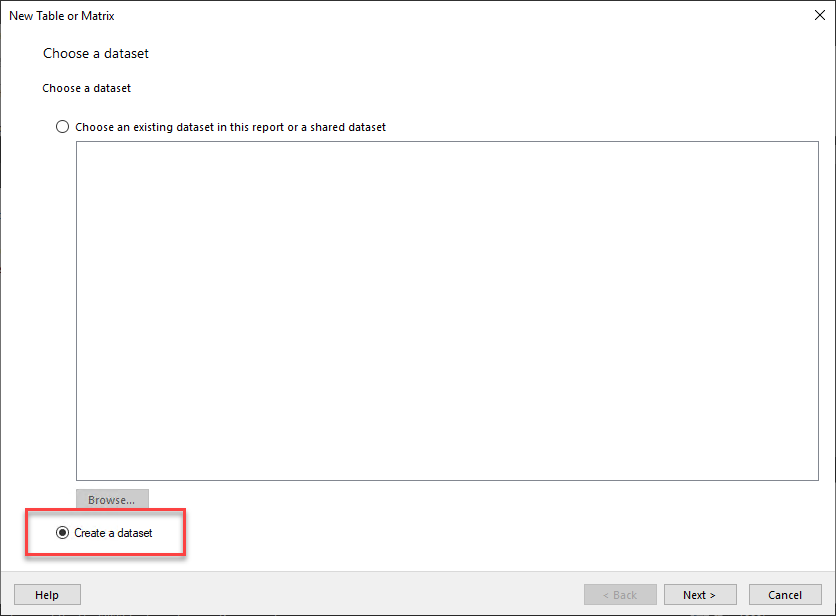
This first screen allows you to select the dataset that you want to use to generate your report. If you have existing datasets, they will be listed in the central panel.
- To create a new dataset check the Create a dataset radio button and then click Next.
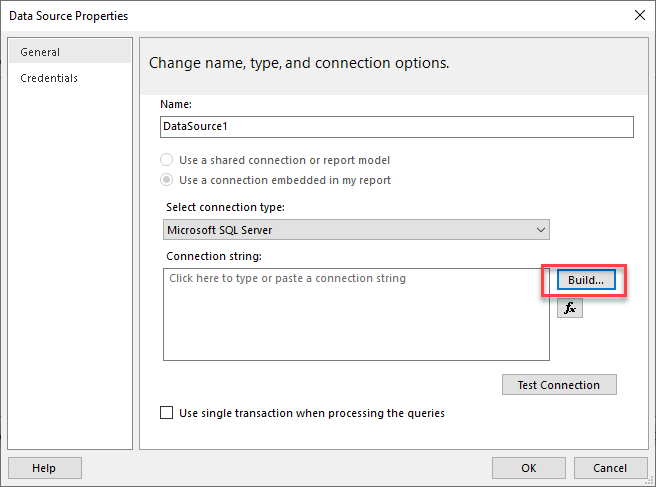
- In order to create a new dataset, you need to connect to the backend SQL Server instance which is what the Data Source Properties dialog enables you to do. Here you give your new dataset a name. In this example it uses the default name of DataSource1.
- Next, select the default connection type of Microsoft SQL Server then enter the connection string. The connection string contains information about the SQL Server instance that you want to connect to. You can type in the connection string manually or build one by clicking the Build button that you can see on the right. This will display the Connection Properties dialog that you can see in the following figure.
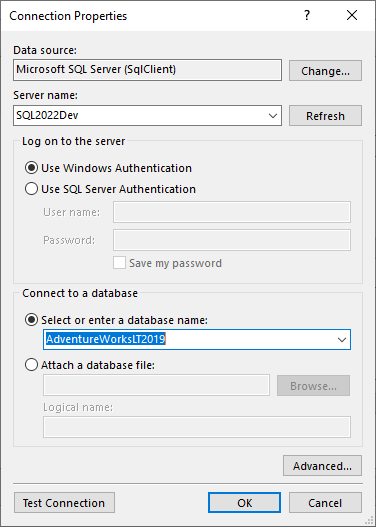
- In the Connection Properties dialog first your first need to specify the data source type which for SQL Server will usually be the .NET provider Microsoft SQL Server (SqlClient).
- Next, provide the server name of the SQL Server database engine. This is the instance name of your SQL Server system. Here you can see I used SQL2022Dev.
- Then select the authentication type. Windows Authentication uses the credentials from your current login while SQL Server Authentication uses the credentials from the SQL Server login you specify. In either case you need permissions to access the SQL Server tables that you want to use in your reports.
- Next, select the database that contains the tables that you want to use. Here you can see the AdventureWorksLT2019 database has been selected.
- When all the server connection information has been entered click OK to redisplay the Data Source Properties dialog that you can see below.
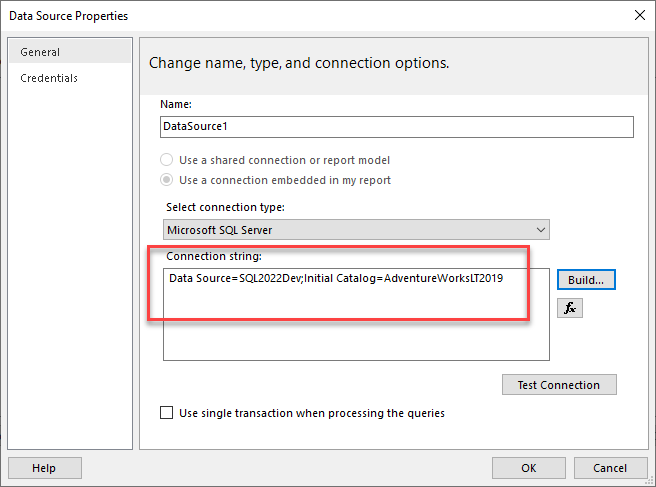
The connection string that you created in the previous dialog will be displayed.
- You can optionally test the connection or to accept the connection and move forward in the report wizard.
- Click OK to redisplay the New Table or Matrix Data Source Connections dialog that you can see below.
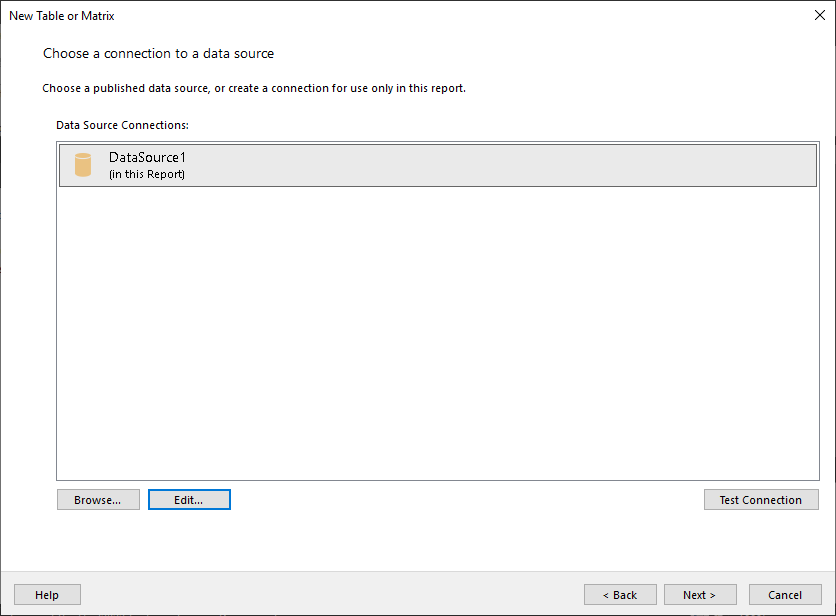
- On the dialog below, you need to select the dataset that you want to use. In this example it’s DataSource1, which is the data source that we just created.
- Clicking Next will display the Design a query dialog that is shown in the following figure.
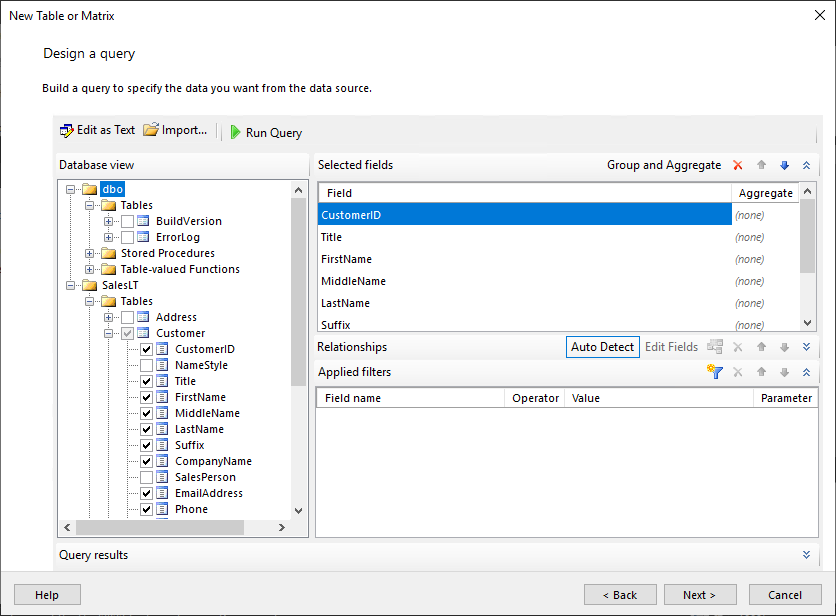
Here you can see the different tables and schema that are in the AdvantureWorksLT2019 database.
- You can click the plus sign that’s shown on the left of each table to drill into the columns that comprise the different tables.
- Checking a table or its columns will add the column to the Selected fields pane that you see in the upper left portion of the dialog.
- You can select multiple tables and columns from each table and these can be joined like you might expect. In this simple example you can see that only a few columns from the Customer table have been selected.
- Clicking Next displays the Arrange fields dialog that you can see below.
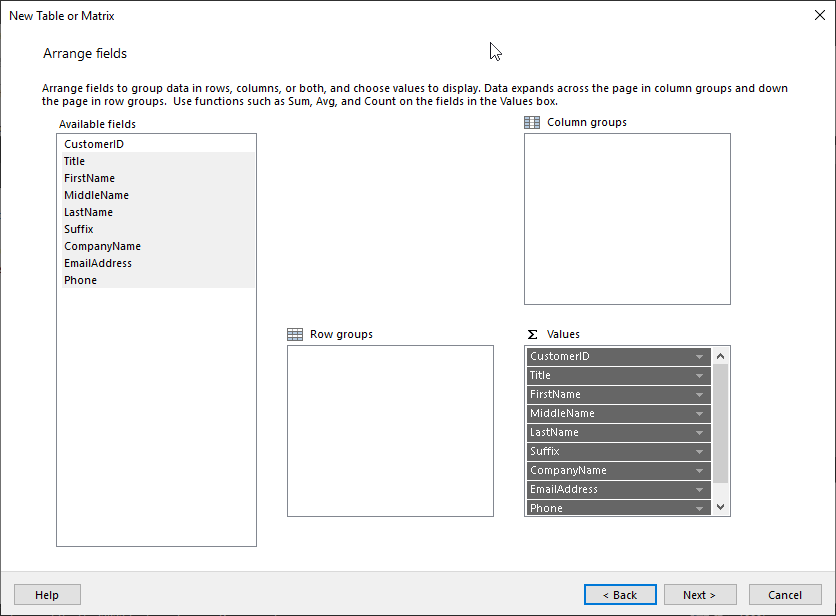
The next dialog enables you to select and reorder the columns that will appear on the report.
- Drag the field names from the Available fields list to the Values list.
The field names in the Values list will all be displayed on the final report. The Column groups and Row groups boxes enable you to create groupings for subheadings and calculated fields like sums and averages on each row. In the simple example report we are not using Row groups or Column groups. Instead, we are simply listing out the column values from the Customer table.
- After you’ve selected the fields that you want clicking Next will display the Choose the layout wizard screen that you can see in the following figure.
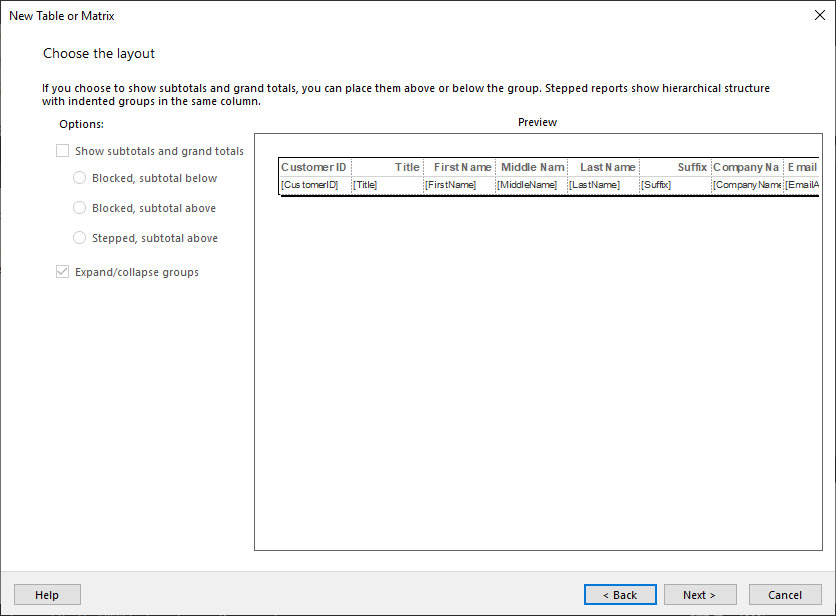
The Choose the layout wizard dialog enables you to preview the report as well as make various edits and appearance changes. In the preceding figure, you can see how the different columns from the example Customers table have been laid out on the report.
As you can see on the left side of the screen, creating different types of subtotals is one of the screen’s main functions. In this simple example, we are not using any subtotals.
- When you have finished making your formatting changes to the report clicking Next will display the following Preview screen.
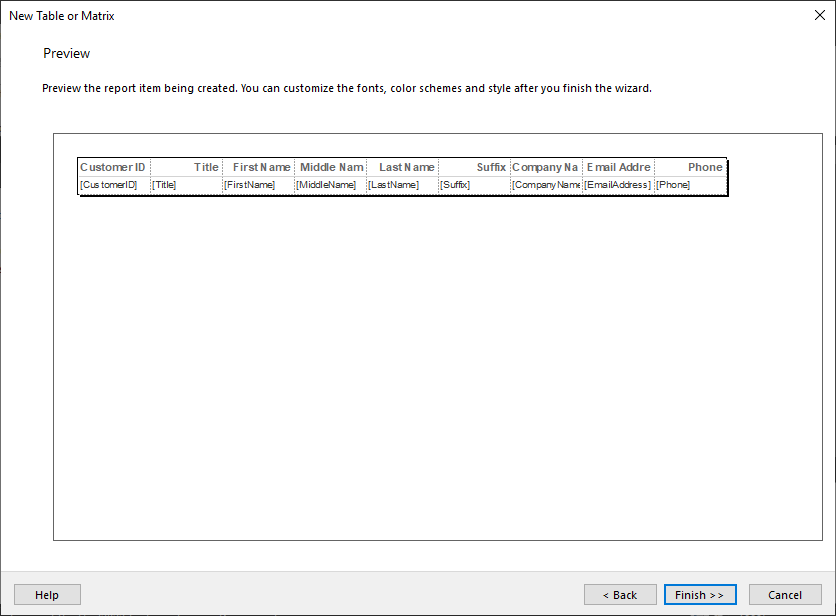
Here you can continue to fine tune what the report will look like. For instance, you can use the Report Builder designer to change the report header, remove fields from the report, rename the headings or you can change the font, text alignment and spacing of the different fields.
As you can see in the following figure, you can right-click each different design element will display a context menu that enables you to work with each field’s properties.
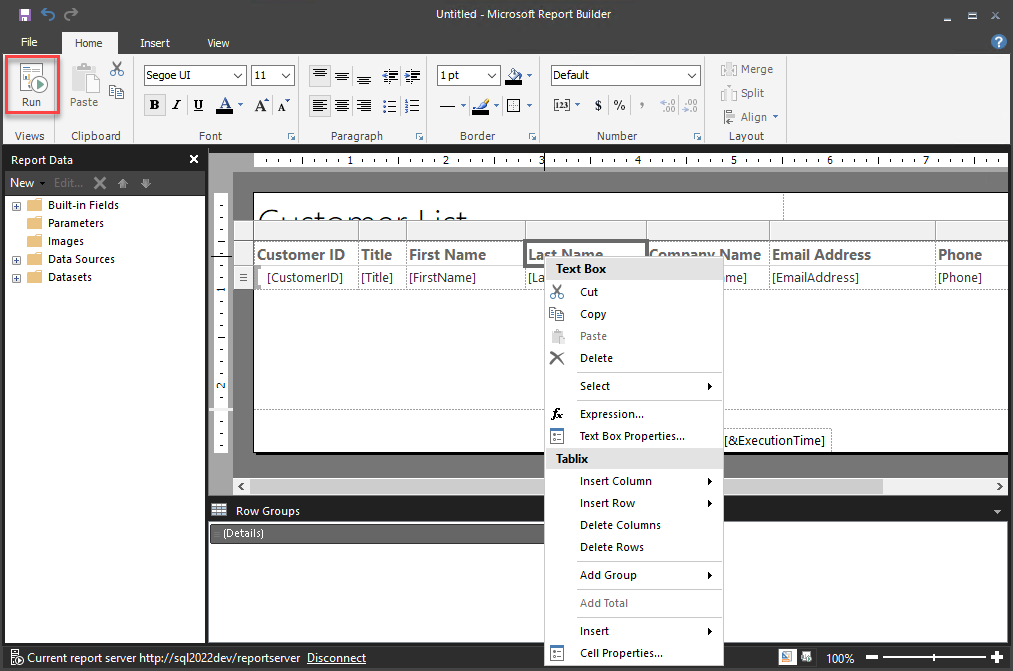
Report Builder’s design view allows you to customize your reports. The pane on the left provides access to built-in fields, which include items like Report Name, Report Folder, Page Number, Page Name, Execution Time, Total Pages, User ID and more.
The Parameters node allows you to pass parameterized values into the report just prior to running it. This example does not utilize any parameters. Like you might guess the Data Sources and Datasets node list the data sources and datasets used by the report.
- When you have finished making your formatting changes to the report, click the Run icon shown in the upper left will display the report. The initial display is a visual report like you can see below.
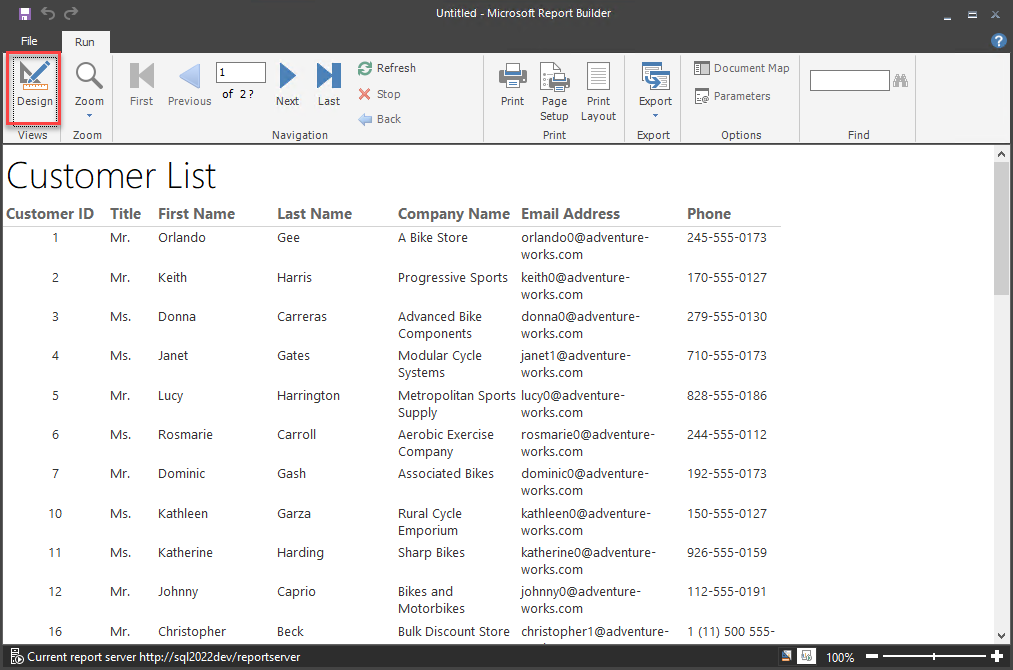
Arrow icons on the toolbar allow you page forward and back through the report’s pages. You also have the option to print the report or find specific report values. You can export reports as Word, Excel, PDF, TIFF, MHTML, CSV, or XML documents. SSRS reports can be embedded in Windows, web, or mobile applications.
If you want to continue to tweak the format and make other design changes to the report, you can click the Design icon in the upper left portion of the screen to return to the Report Builder designer screen. You can actively toggle back and forth between the design view and the run view using the Run and Design icons.
Clicking the disk (save) icon in the upper right corner will save your project. Report security settings are managed using the SSRS report manager web portal.
Summary
In this tutorial, you learned how to create SSRS reports using Report Builder. This article showed how to download and install SSRS Report Builder as well as how to use the Tables and Matrix Wizard to create and run your first Report Builder report.